• Premium
  • myVentusky
  • About
  • New High-Resolution NAM Model Now Available for the U.S. and Hawaii NAM
    Temperature
    Feels like temperature
    Precipitation
    Radar
    Satellite
    Clouds
    Wind speed
    Wind gusts
    Air pressure
    Thunderstorms
    Humidity
    Sea
    Snow cover
    Air quality
    PlayPreviousNextChange dateToday, 2025/03/1400:0003:0006:0009:0012:0015:0018:0021:00
    MoTuWeThFrSaSu
    10111213141516
    17181920212223
    24252627282930

    Data: GFS, NOAA (resolution 22 km)
    Updated: 18:00 UTC (next update: 00:00 UTC - prepare)
    Current time: 03:00, 2025/03/14 (UTC)

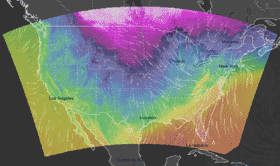
    The map shows the temperature anomaly from the long-term average for a given time. This average is based on the period 1980-2020 (40 years). Temperatures above average are displayed from orange to red colors, and below average are displayed from blue to purple.

    WebcamsWeather fronts
    ShareSettingsPremiummyVentuskyAbout
    0 °CDes MoinesFargoRochesterSioux FallsCedar RapidsOmahaMinneapolisDallasMemphisOklahoma CityLittle RockShreveportJacksonAbileneColumbiaWichita FallsSpringfieldKansas CitySaint LouisTulsaWichitaTorontoChicagoDetroitMilwaukeeGrand RapidsFort WayneMadisonErieGreen BaySudburyLondonClevelandCharlotteIndianapolisNashvilleColumbusColumbusChattanoogaKnoxvilleBirminghamGreensboroLouisvilleSpringfieldEvansvilleCharlestonColumbiaSavannahPittsburghCincinnatiMeadsAtlantaMontréalQuébecBostonOttawaRochesterKingstonTrois-RivièresSaguenaySyracuseSherbrooke
    Β°C201510520βˆ’2βˆ’5βˆ’10βˆ’15βˆ’20